January 14 marked the 2-year anniversary of my solar PV system getting connected to the grid. Last year, I celebrated my first solar anniversary by sharing all my solar data for the year. Since I think it’s important to continue to spread the word about solar energy, I’ll share all my system and cost data again.
As I said, a big reason for me sharing this data is that I want to encourage others to install solar at their house. Note: the financial picture for residential solar in Arizona will change soon (and in favor of the utilities, not you), so if you’re in AZ and have been thinking about going solar but haven’t gotten around to it, DO IT NOW. If you have any questions on this, I encourage you to talk to the very knowledgeable staff at Net Zero Solar, the company I got my system from.
System summary (copied from last year’s post)
I made my purchase in December 2015, just in time to get the tax credit on my 2015 taxes instead of having to wait a full year. After getting proposals from three companies (2 local, 1 national), I decided to go with one of the local companies, Net Zero Solar. Net Zero’s proposal was the least expensive, and it was also clear they really know their stuff and are in the solar business because they think it’s an important thing to do. They’re also down-to-earth and upfront about benefits, downsides, the local utility’s compensation, etc. And I know a bit about solar so I definitely tested them to double check!
Here are the technical details for my system:
- 5.13 kW array
- Comprised of 18 285 kW LG PV panels
- Includes 18 Enphase microinverters
- Unirac SolarMount mounting system
- Array azimuth of 160° from true north
- Panels angled at 20° and 30° from the horizontal (some rows are higher than the others) on my flat roof
- Estimated annual PV generation: 9,571 kWh
Installed system cost: $16,290.
Tax credits: $1,000 Arizona tax credit and $4,887 federal tax credit
Net system price: $10,403
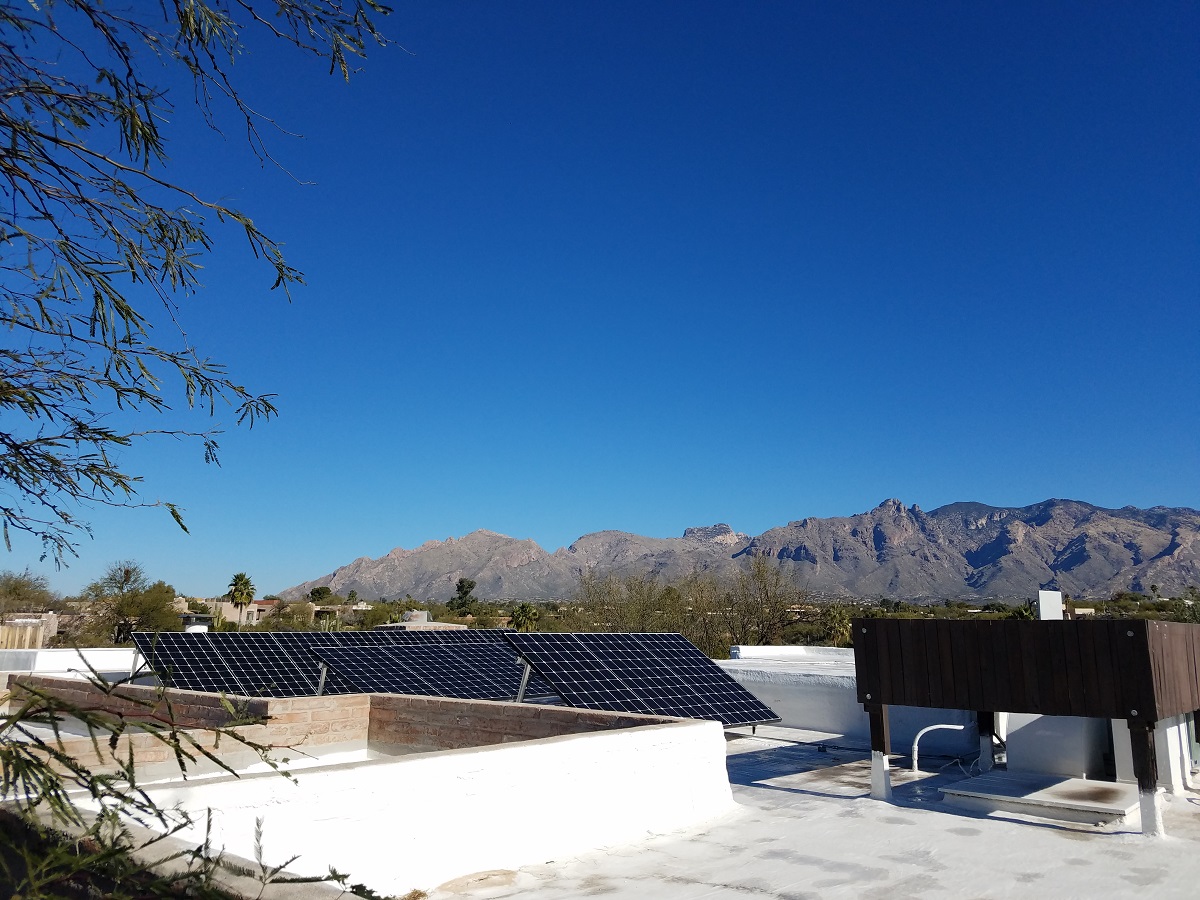
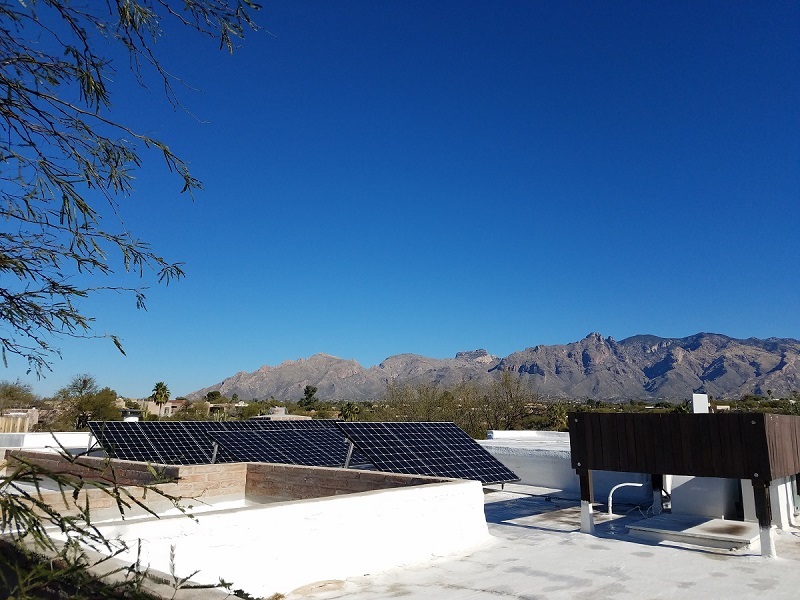
My solar panels! Or at least some of them. And yes, I climbed a tree to take this picture .
My electricity costs before and immediately after going solar
I bought my house in July 2015. My electric bills for August 2015 through January 2016 were: $107, $122, $64, $60, $228; $117. My house is fully electric (no gas), so my expensive months are in the summer when I’m cooling the house and the winter when I’m heating the house (I have a heat pump that both heats and cools the house; no air conditioning!). Autumn and spring are great; I barely have to use my heat pump at all. On top of that, I applied a lot of energy efficiency measures in September and October 2015, and those energy savings were reflected in my bills.
My system was turned on in mid-January 2016. My net electricity costs from then until January 2017 were $138.28.
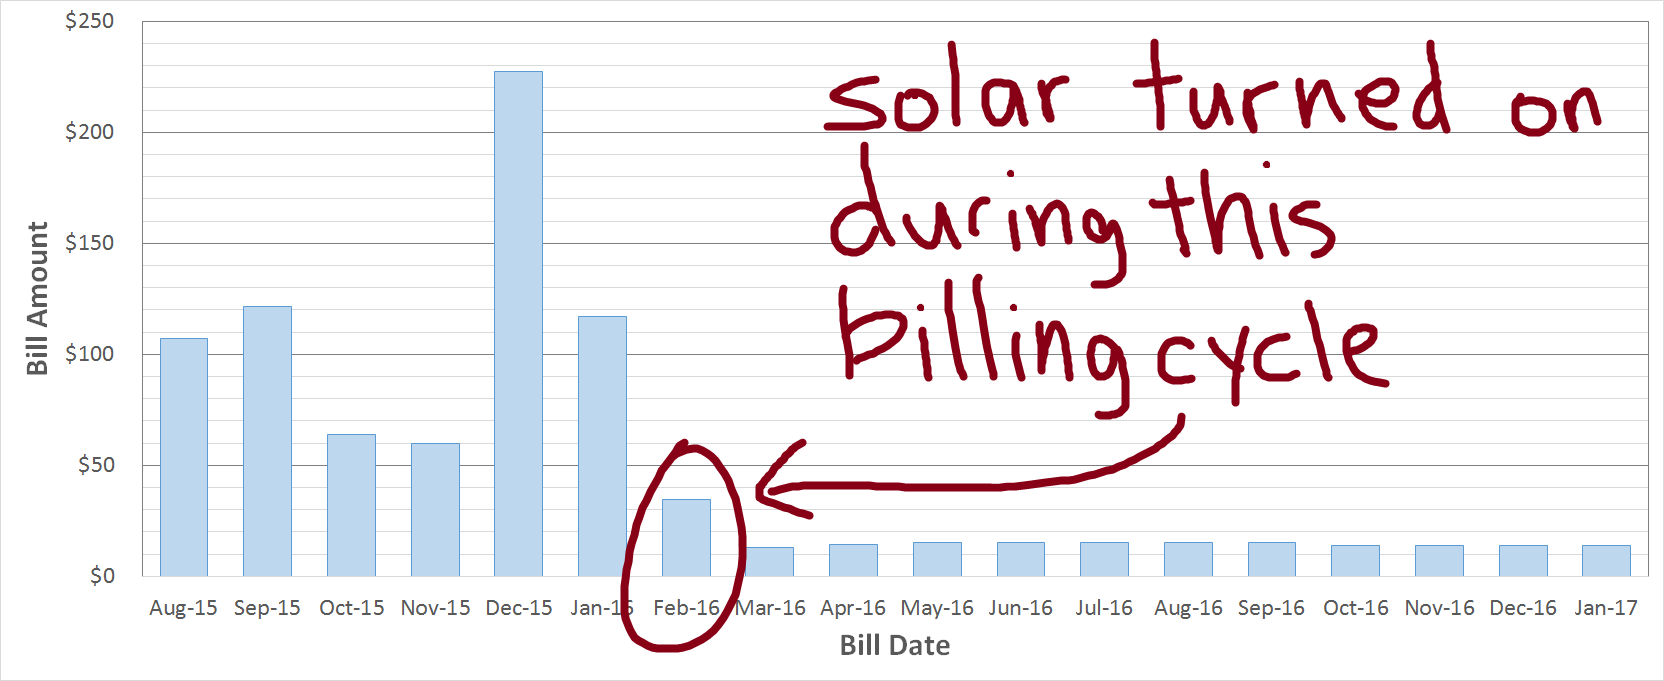
My electric bills before and after going solar.
My electricity costs for the last 12 months
The obvious question: did my costs stay similarly low in year 2 of being a solar homeowner?
The answer: yes. My net electricity costs in the last 12 months (February 2017 to January 2018) were $169.77.
That total includes a monthly bill, which is usually around $18 to $19 dollars. Last year, this bill was usually $15. The increase is because my power company, TEP, raised its monthly customer charge from $10 to $13 in March. A couple other small monthly charges, including a green energy charge, taxes, and other assessments also changed slightly. There was only one month that my bill was significantly higher. That was January 2018, and my bill was a whopping $37.77 that month. It was the only month in the last 12 months that my usage exceeded my saved up solar credits.
The total costs for the last 12 months also includes a $66.46 credit in October for the extra energy my system produced from October 2016 to September 2017 (2531 kWh total). Yes, my PV system is oversized. This is by design, to account for the fact that my next car will likely be an electric vehicle.
The nitty gritty: month-by-month energy generation and usage
I’ve included my monthly energy production and usage details for January 2017 through January 2018 in the table below:
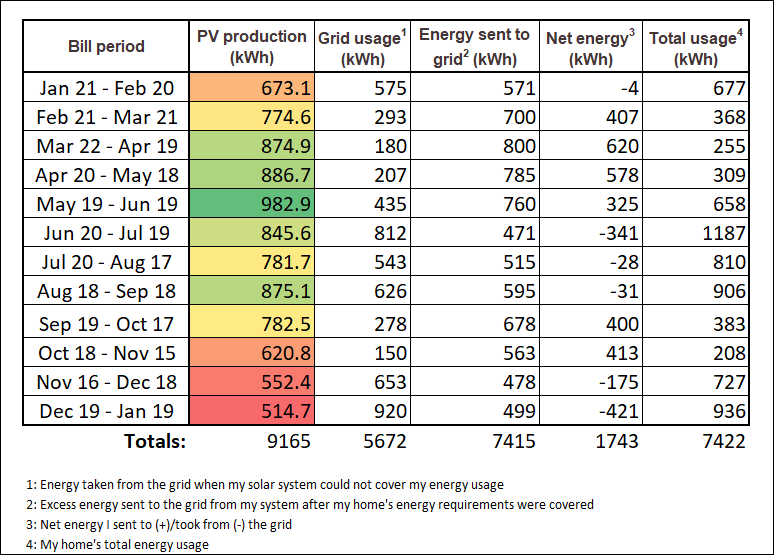
My energy production and usage details for the last year.
Since I’ve based this on my billing cycles, some months are slightly longer than others. Still, you can get a sense of how well the system performed monthly. In the “PV production” column, green indicates more production while red indicates less.
In total, my PV system produced 9,165 kWh in the last 12 months (compared to 9,467 kWh in year 1). This is a decrease of 3%, which could be due to different weather, slight degradation of the panels’ performance, or both.
Just like last year, my best months were April and May, when it’s hot and sunny in Tucson but monsoon season hasn’t started yet. Conversely, my worst months were December and January, when daylight hours are lowest.
Enphase provides a really cool monitoring service for people whose PV systems use Enphase microinverters. It lets you see your system’s production year-to-year, month-to-month, day-to-day, and even hour-to-hour. Here’s a screenshot that shows my daily production for the last 12 months:
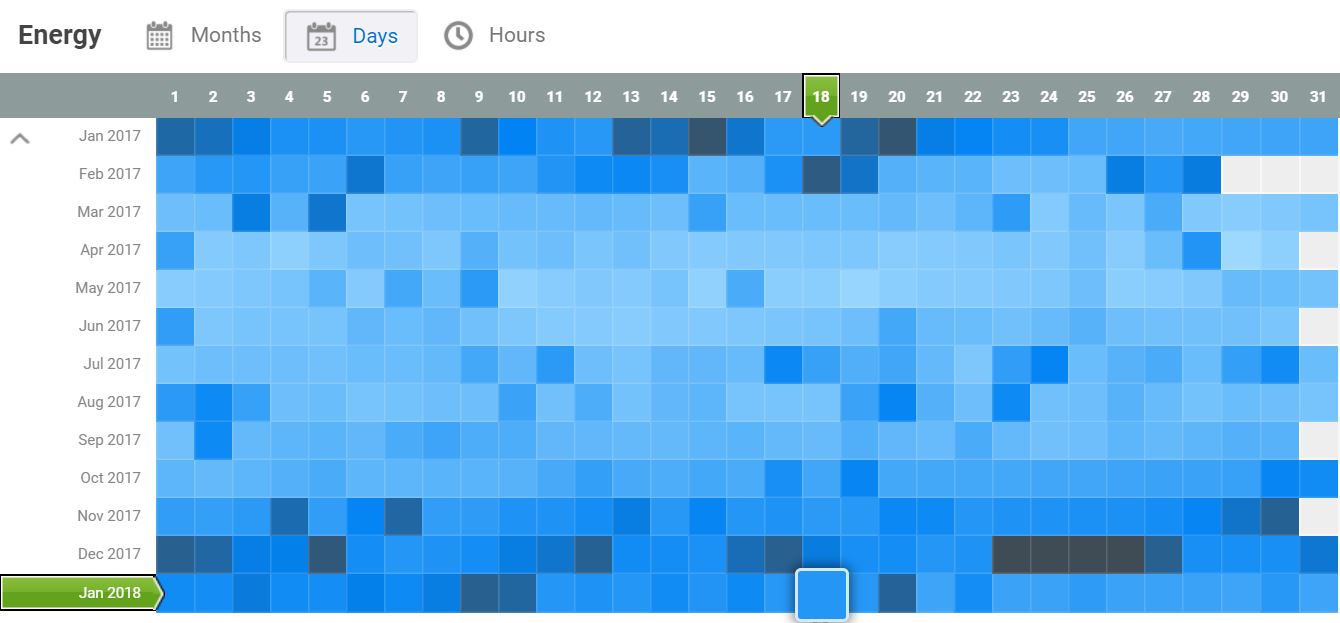
Screenshot of my Enphase Enlighten solar production data for the second year. The lighter the box, the more my system produced that day.
One final important point: my usage was 7,422 kWh last year compared to 6,855 kWh the previous year, an increase of 8%. Yikes! I’ll have to be more careful this year.
Summary
Year 2 for solar has been almost as good as year 1. My total electricity costs went up by about $30 for the year. There were 3 reasons for this:
- TEP raised its monthly service charge
- My solar production was down 3%
- My usage was up 8%
Given that, I’m very happy with my PV system’s performance in the last year. I would certainly recommend solar to any friend considering it, so long as the reimbursement is similar to the deal I have with TEP. But act fast! Utilities across the country are working to undermine the financial advantages of residential solar, so you have to get your system before your utility makes it financially prohibitive to do so.
Thanks for reading! Please feel free to share if you know anyone who could benefit from having a look at solar numbers!
Share this Post